Qumulus Profiler
Accurate, Efficient, Versatile!
Version 2.0: Now with sampling support
Sampling + Instrumentation
Start sampling your application right away with zero setup. Or instrument it for extremely high precision.
Sampling goes up to 8KHz on Windows and up to 35KHz on macOS. Instrumentation handles millions of activities per second, so you can even see down to the microsecond what is happening when.
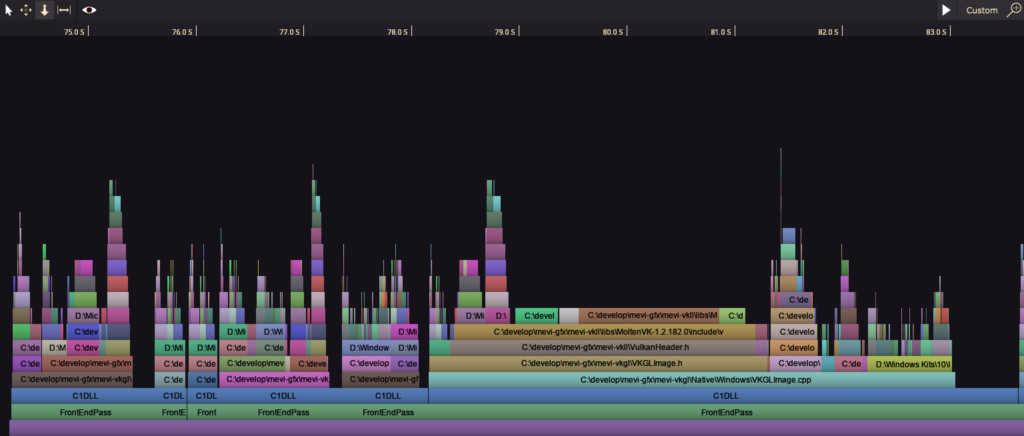
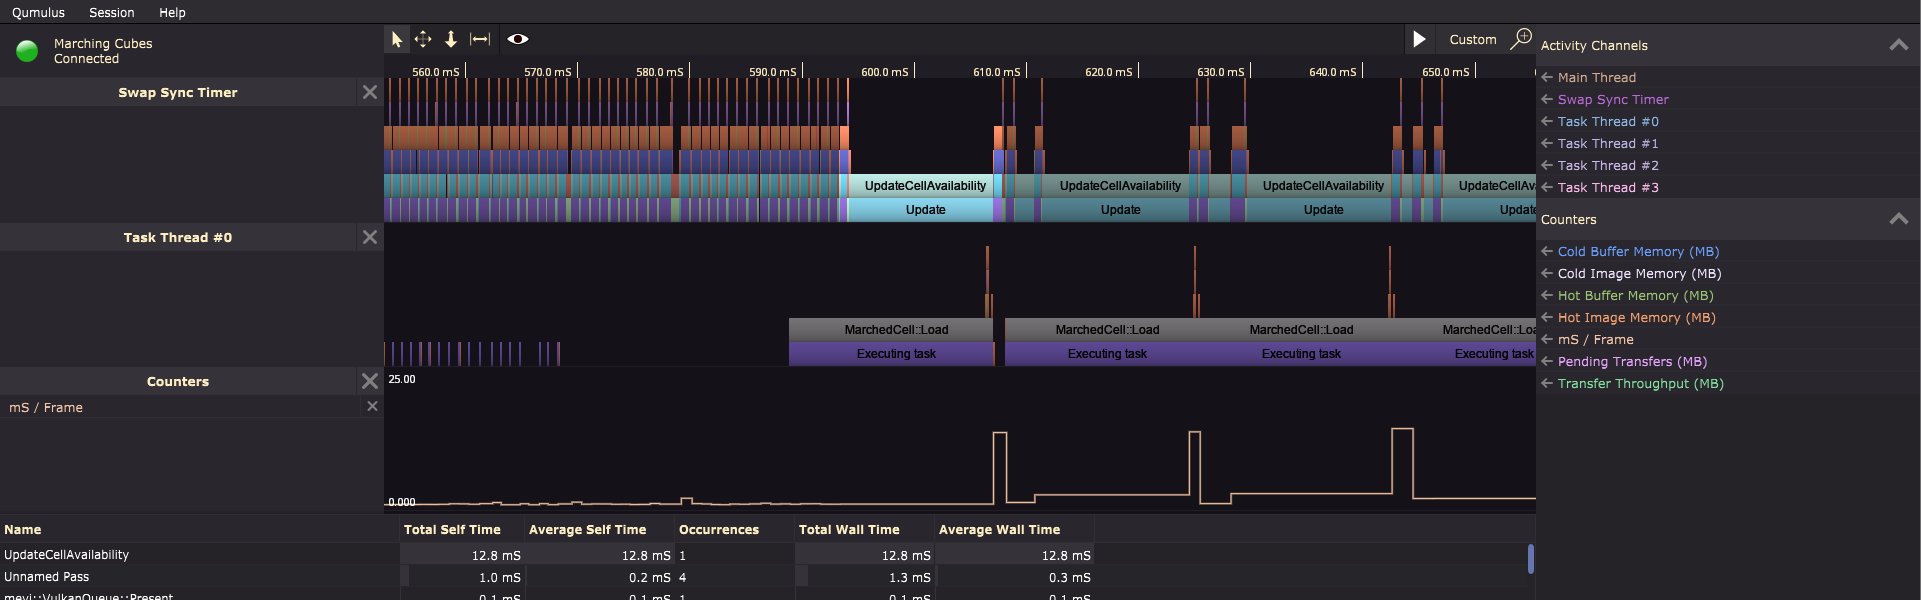
Visual approach
With a visual representation of the timeline you can quickly see what is executing and when.
Long running operations will stand out visually so you know where performance can be improved without digging into the numbers.
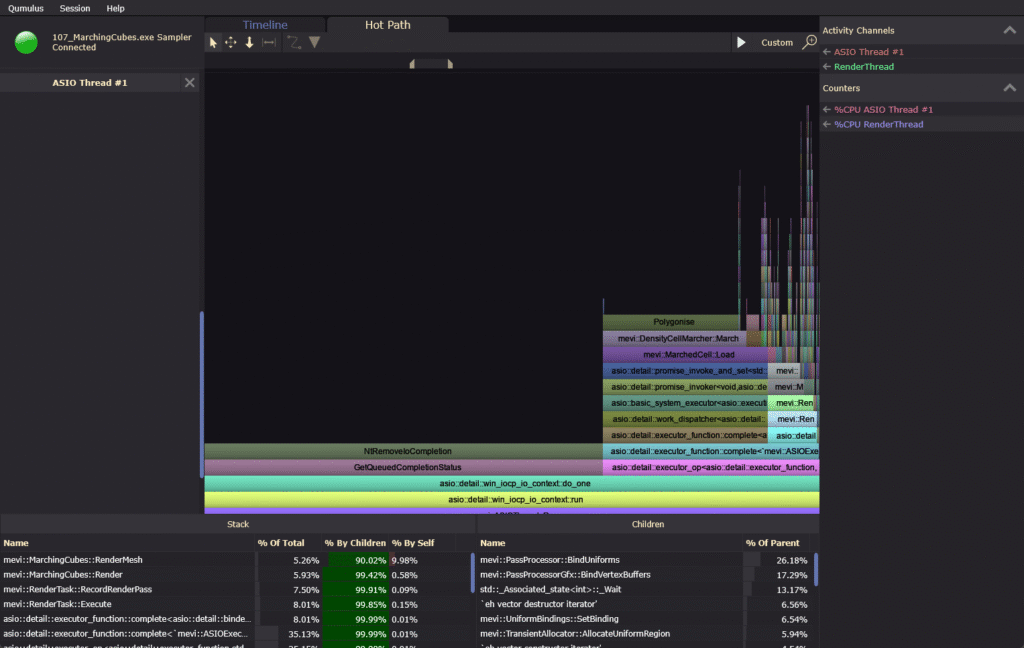
Hot Paths
Accumulate repeating call-stacks and show them sorted by their total time spent.
Group repeating patterns like rendering, updating or database access together. This will show you the heaviest call-stacks so you know where to focus optimization efforts.
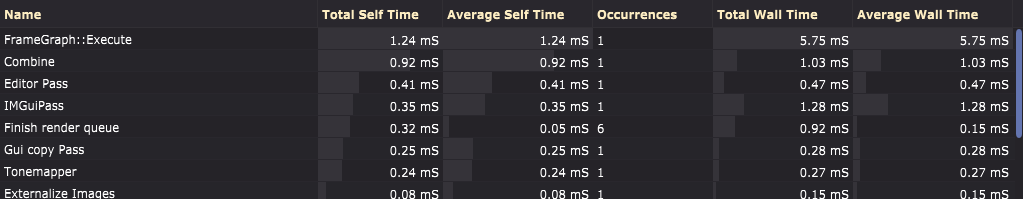
Assisted probing
Once you’ve determined an area of interest, Qumulus will show you a clear overview of how much each operation contributes to your performance issue.
Live Profiling
Qumulus’ live profiling mode allows you to look at your application’s performance as it is running. This way you can catch performance issues you didn’t even know you had.
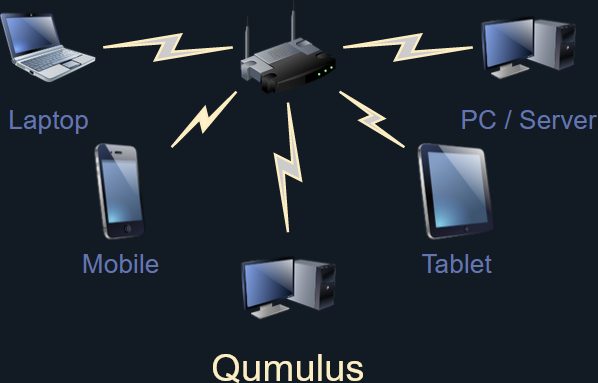
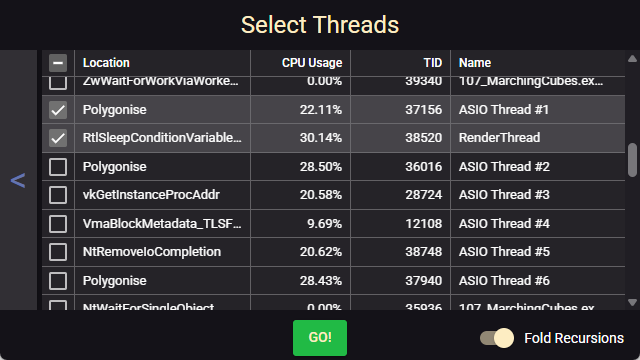
Remote Profiling
Does your app want to use 100% of the device’s resources? Run the profiler on a different machine. This also enables you to profile applications running on mobile devices for example.
or
Get a License
-
 Qumulus 1 Year€ 99,00
You can download and try out Qumulus completely free. If it suits your needs you can buy a license to start optimizing your own apps. Each license comes with full support and free updates.