Sources
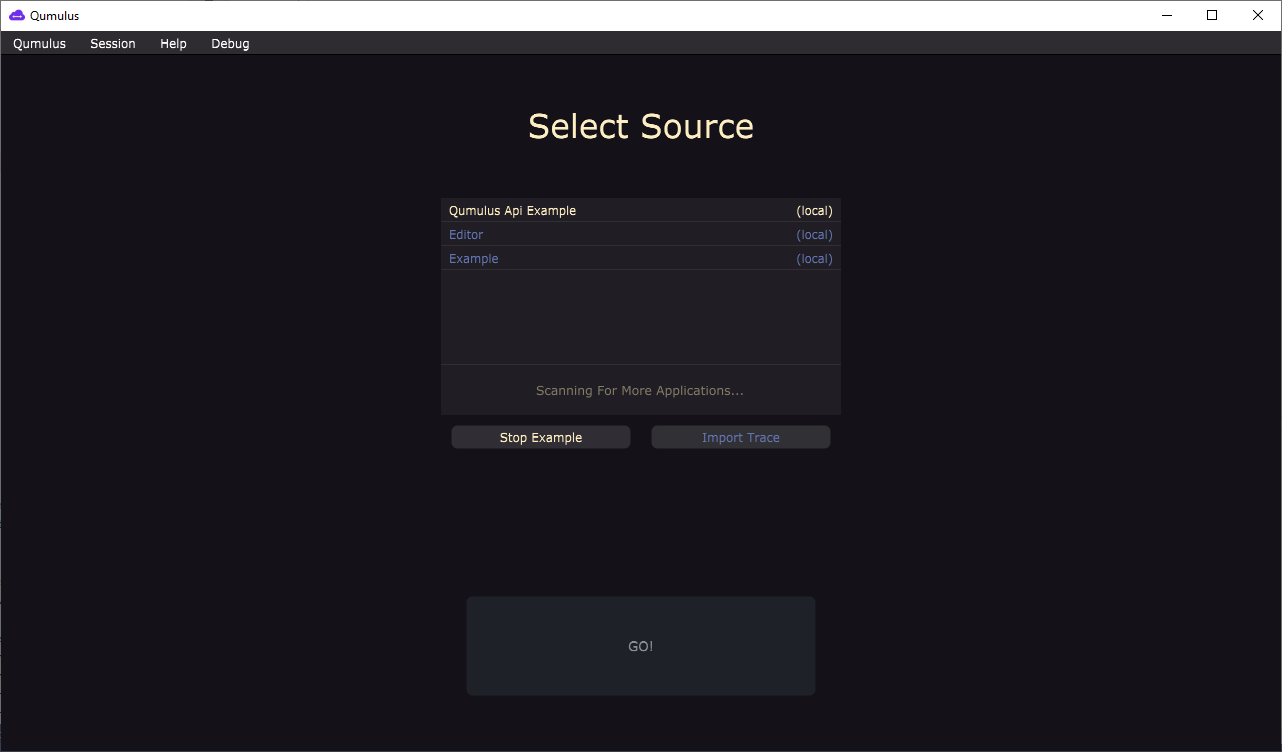
The source selection panel is where you select the source of performance data. It will look something like this:

Applications
The list contains currently running applications in yellow. Once you’ve instrumented your application it will be shown here on the top of the list. You can connect to the application and see it’s performance as it is running. The applications are enumerated from the network so you can even run your application on one machine and profile it on another.
Trace files
The list also contains previously saved traces in blue. You can save and load trace files so that you can inspect them later, compare them with a new trace or to send them to someone else. The trace files are stored in your user documents folder and can be deleted by right clicking them.
Importing
Sometimes you might want to open a trace generated in a different format. For example the Chromium trace format. By pressing the Import Trace button you can select the json file from which you want to import performance data.
Importing trace files is also useful when you need to generate a trace on a specific machine or when you have a user experiencing an unreproducable performance problem.
Example
The Launch Example / Stop Example button allows you to run the example application supplied with the QuSDK. This enables you to see what the code shared here generates and how that’s being shown in the timeline.